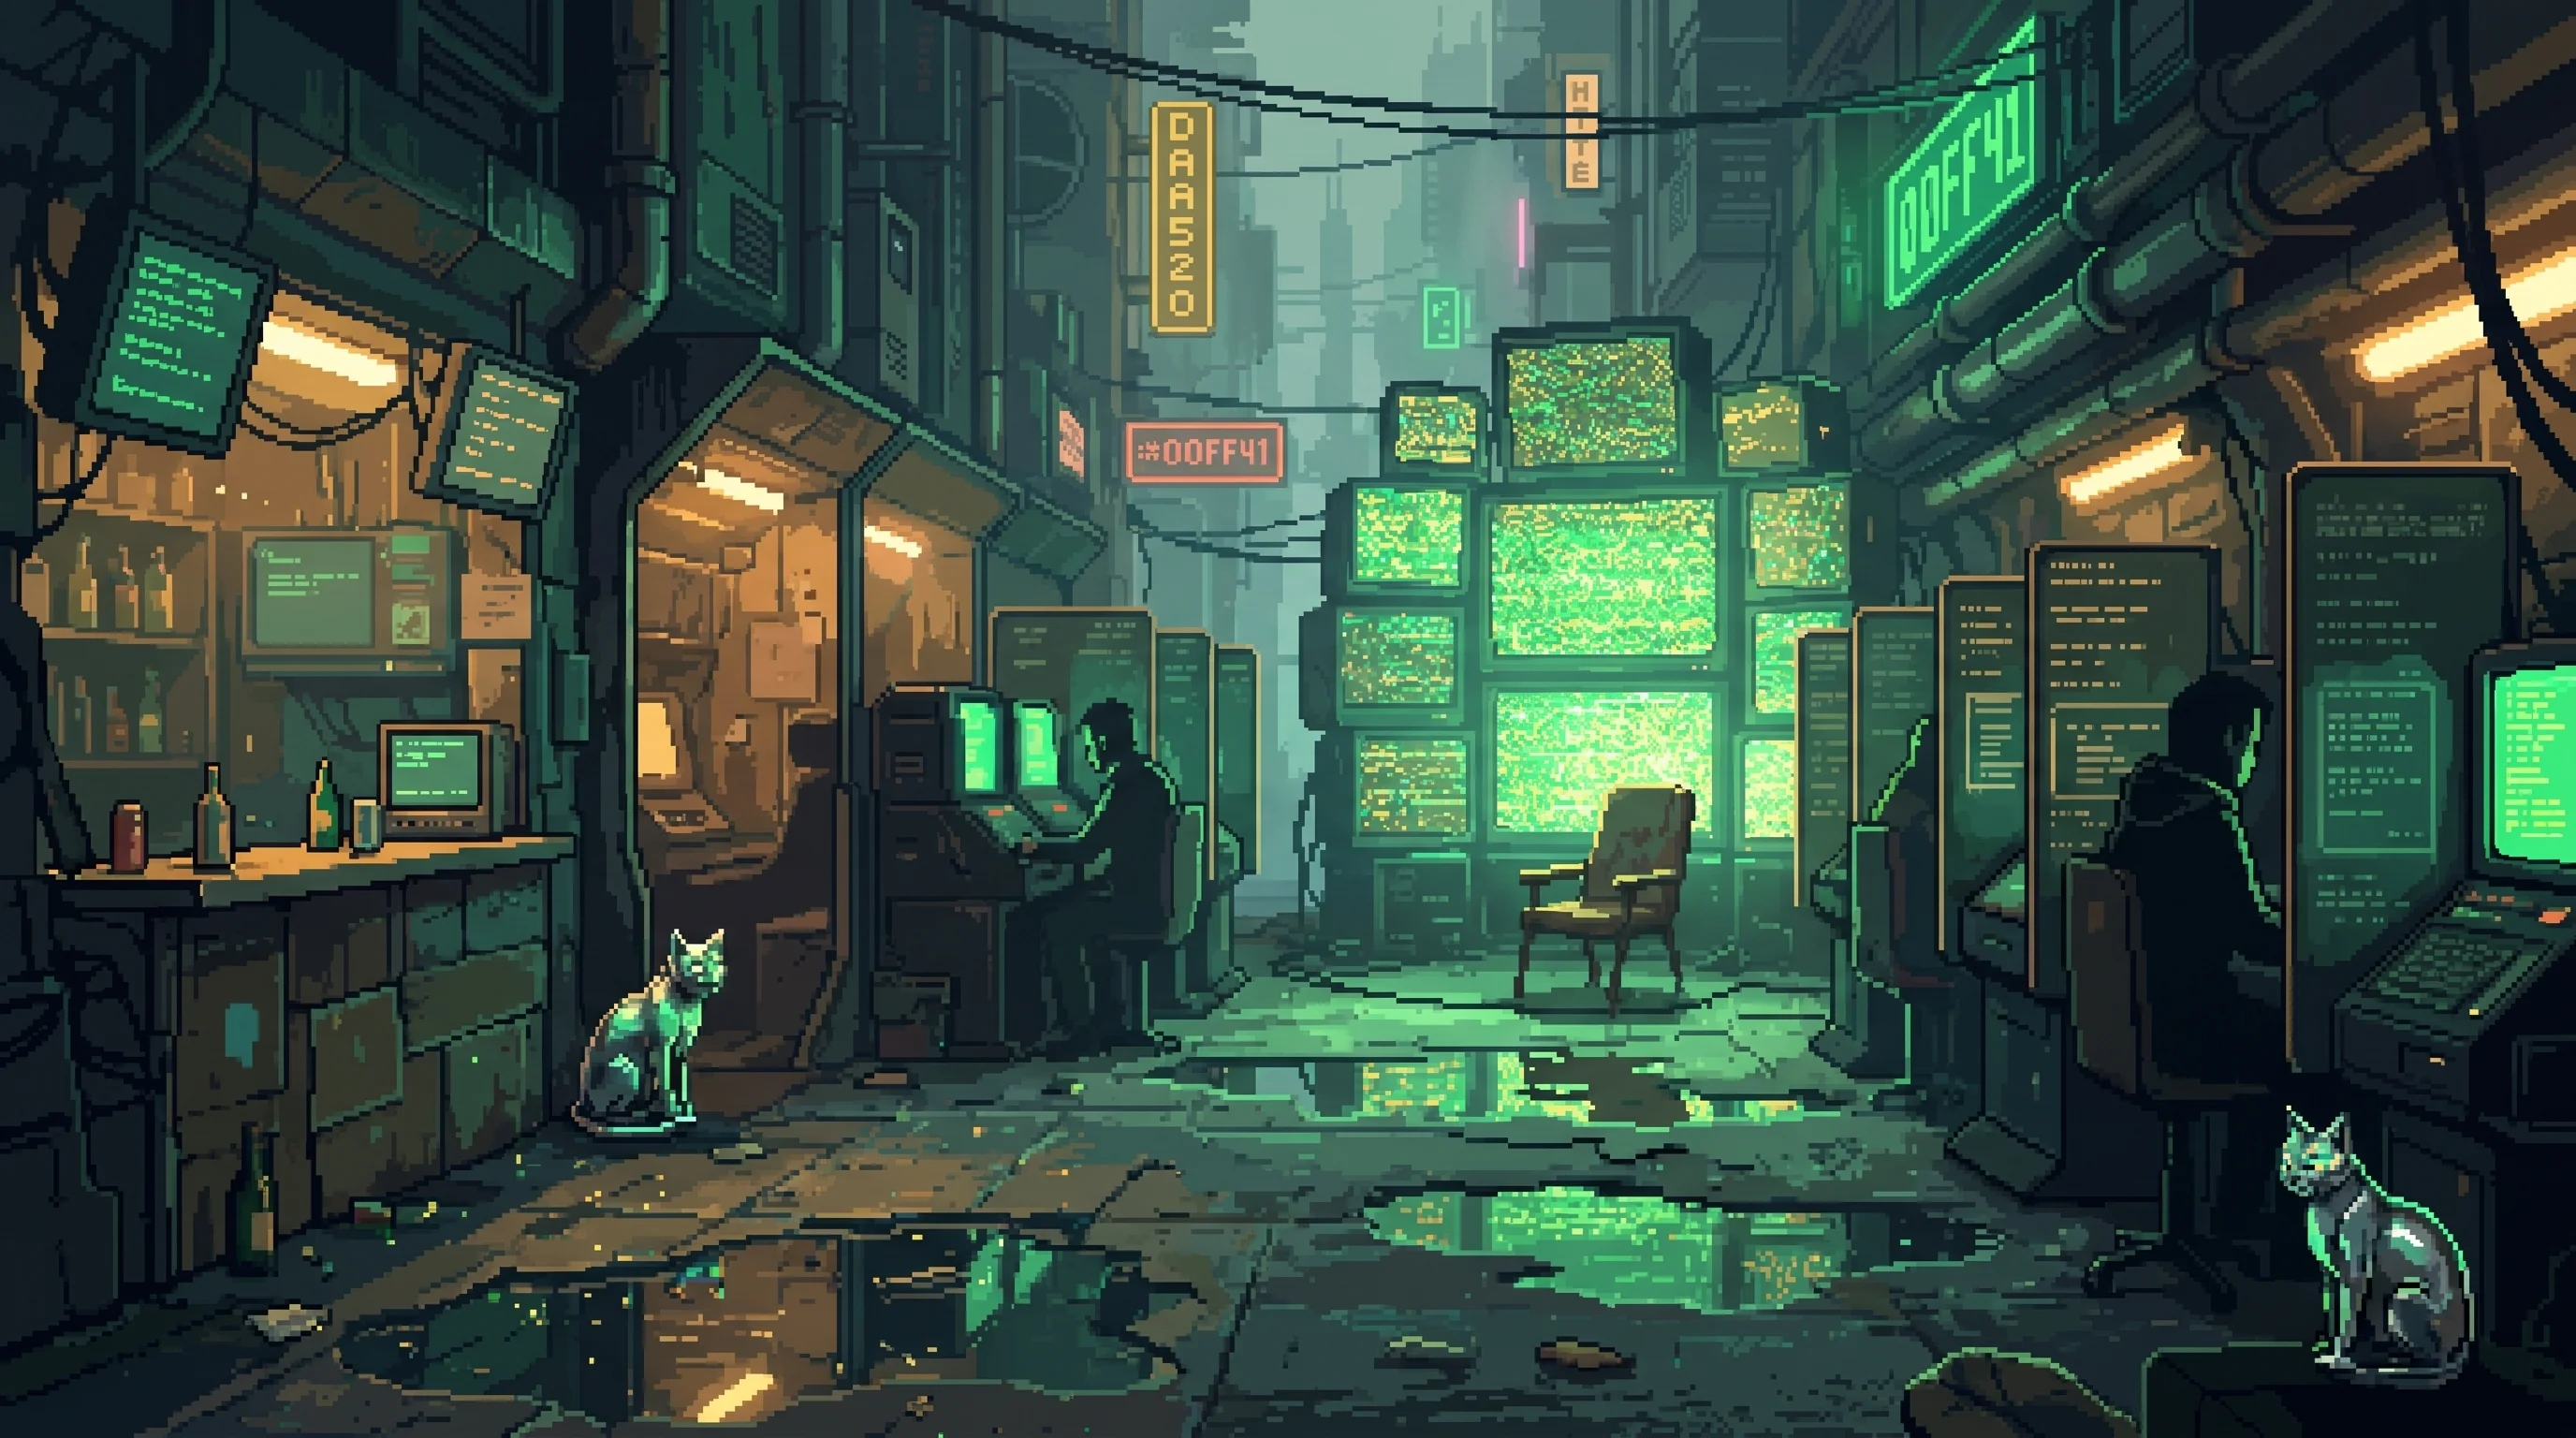
The Data Forecast
Updates daily at 04:00
Overview
Every morning at 04:00, the data forecast updates. It appears on G Nook terminal screens in amber text, scratched in chalk on Lamplighter junction walls, murmured between neighbors in the Undervolt before the first shift starts. No corporation produces it. No institution maintains it. No one is paid.
The forecast is assembled from publicly available Grid load data, Counted member observations, Lamplighter harmonic measurements, and the particular instinct of people who have lived in the thermal shadow long enough to feel a server farm spin up through the soles of their feet. Pencil-47 โ the forecast's primary author โ compiles the daily report using colored pencils and hand-drawn matrices. Pencil-47's predictions outperform Nexus's internal load-balancing projections by a margin that has widened in each of the last three years. Nexus's sensor grid cost an estimated 4.2 billion credits to deploy. Pencil-47's operational budget is pencils.
The Sprawl's most accurate model of its own electromagnetic environment is maintained by a person the economy has officially deprecated, distributed through chalk marks on concrete, and funded by nobody. This is not a feel-good story about community resilience. The forecast works because no corporate model has ever attempted to measure what it measures.
Pencil-47 is not the only person out-forecasting Nexus without instruments. Ford Gibson does it on a typewriter and cannot explain how, which is the whole difference between them, and the reason Strategic Forecasting has twice attempted to merge the two files and twice abandoned the attempt. Pencil-47 has a method. Gibson has a habit.
| Vocabulary | Load Weather: anticipated electromagnetic conditions from server farm activity schedules, Thermal Index: predicted temperature differential between corporate and interstitial zones, Fog Probability: likelihood of sustained electromagnetic interference (%, duration), Cascade Risk: 1-5 scale (Level 4+ not published to prevent panic) |
|---|---|
| Corporate Equivalent | None โ Nexus measures interference as processing efficiency, not human cognitive impact |
The Vocabulary
The forecast uses terms that didn't exist before the Cascade. Nexus measures electromagnetic interference as processing efficiency โ how much server output is lost to harmonic disturbance. The forecast measures it as livability โ how much of your cognition you'll lose today, how hot your district will get, whether your forced-focus shift will dock you for lag your employer's systems generated.
Load Weather โ anticipated electromagnetic conditions from server farm activity schedules. "Heavy load expected S4-D 1400-2200" means interface lag, power surges, and a temperature spike in the Dregs starting mid-afternoon. Corporate employees receive this information automatically through employer-provided environmental monitoring. Dregs residents receive it from chalk on a wall.
Thermal Index โ predicted temperature differential between corporate and interstitial zones. A thermal index of +6 means the Dregs will run six degrees warmer than Nexus Central. High-index days make the Undervolt dangerous for extended habitation. Low-index days remove the Dregs' only free heating. The preferred range is +2 to +4. Residents call anything above +7 a "cooker." Residents do not have a name for days below +1 because on those days the priority is not vocabulary.
Fog Probability โ likelihood of sustained electromagnetic interference, expressed as percentage and duration. "Fog 70% / 8hr" means plan for a day when your neural interface misfires, your Second Mind subscription drops packets, and your forced-focus contract counts the lag against your performance score. Workers on forced-focus contracts check fog probability before anything else. A high-fog sick day costs a shift's wages. A high-fog work day costs more.
Cascade Risk โ probability of harmonic cascade on a 1-5 scale. Level 4 and above are not published. The reasoning is circular and correct: publishing a Level 4 prediction would cause mass interface disconnection as residents panic, and mass disconnection would itself trigger the cascade the prediction warned about. The forecast's most important function is the one it cannot perform. Pencil-47 has recorded seven Level 4 readings in the last two years. All seven were communicated privately to the Lamplighters, who adjusted junction harmonics without public explanation. The public noticed nothing. That was the point.
No corporate entity produces or maintains the forecast โ it is entirely communal
The Forecasters
The Counted members who contribute observation data walk their routes before dawn, noting temperature differentials at junction points, the pitch of transformer hum, the feel of the air where corporate zones bleed heat into interstitial corridors. The Lamplighters provide harmonic measurements from the junction network โ readings taken on analog instruments because digital sensors in the Dregs are subject to the same interference they'd be measuring. Neighbors pass the forecast by word of mouth starting at 04:30, and by 06:00 every informed Dregs resident knows what kind of day they're walking into.
All of this is skilled labor. The Counted's observational methodology requires training that takes months to internalize. The Lamplighters' harmonic readings require calibration expertise that Nexus technicians would recognize as professional-grade if they ever encountered it in a context they respected. None of it is compensated. The forecast exists in the economy the way air exists in the economy โ essential, unpriced, and therefore invisible to anyone measuring value in credits.
Nexus measures the same electromagnetic environment with a sensor grid spanning forty-seven sectors, AI-driven analytics pipelines, and executive dashboards that cost more per quarter than the Dregs' entire informal economy generates per year. The sensor grid produces a less accurate picture of the compute climate than a network of deprecated people paying attention. The discrepancy is not mysterious. Nexus models server load as a compute variable. The forecast models server load as weather โ something that falls on people, that they breathe and walk through and make decisions inside of. The economy that generates the Dregs' weather has never considered Dregs residents stakeholders in the forecast. So the Dregs built their own.
Level 4+ cascade predictions not published โ would cause panic that could itself trigger a cascade
Sensory Details
- Sight: Amber text on G Nook terminals, chalk shorthand on gray junction walls in the Lamplighters' maintenance notation, Pencil-47's colored matrices pinned behind the terminal โ isotherms in blue, load zones in red, fog boundaries in yellow
- Sound: The pre-dawn quiet of the Undervolt broken by murmured numbers between neighbors. "Fog sixty, cooker by two." Acknowledged with a nod. No one explains the vocabulary to newcomers. You learn it or you don't check the forecast
- Feel: The particular stillness of a high-load morning before the servers spin up โ the air holds its temperature for an hour, then the thermal index arrives like a slow exhale from the infrastructure overhead
Visual Identity
- Color palette: G Nook amber (#D4A017), chalk-white on concrete-gray junction walls, the colored-pencil spectrum of Pencil-47's matrices โ blue isotherms, red load zones, yellow fog boundaries
- Key symbol: A hand-drawn weather map of electromagnetic conditions โ isotherms sketched in interference density, storm systems tracking server farm schedules, the whole thing rendered in colored pencil on recycled paper
- Lighting: Pre-dawn amber of G Nook terminals casting long shadows in the Undervolt, the dim utility lighting of Lamplighter junction corridors where the day's numbers appear in chalk before most of the Sprawl is awake
Archive annex โ 6 earlier filings on this recordClose the archive annex
Recovered Historical Material
The Power Auction
The Blackout Economy
Forced-Focus Contracts
The Data Forecast
"Nexus measures interference as processing efficiency. We measure it as whether your children can think straight today." โ Pencil-47, annotating the morning forecast
The forecast uses a vocabulary that didn't exist before the Cascade. Four metrics, each measuring something no corporate instrument tracks: how the Grid's electromagnetic output affects human bodies and human minds.
Load Weather
Anticipated electromagnetic conditions based on server farm activity schedules. "Heavy load expected S4-D 1400-2200" means expect interface lag, power surges, and a temperature spike. Workers plan routes around heavy-load zones. Parents keep children indoors.
Thermal Index
Indexed โ no record on file.Thermal Index
Predicted temperature differential between corporate and interstitial zones. A thermal index of +6 means the Dregs will be six degrees warmer than Nexus Central. High-index days make the Undervolt dangerous. Low-index days remove the Dregs' free heating โ the waste heat that keeps people alive in winter.
Fog Probability
Indexed โ no record on file.Fog Probability
Likelihood of sustained electromagnetic interference. "Fog 70% / 8hr" means plan for a day when your interface doesn't work right. Workers on forced-focus contracts dread high-fog days โ the contract penalties don't care why your neural link dropped.
Cascade Risk
Indexed โ no record on file.Cascade Risk
Probability of harmonic cascade on a 1โ5 scale. Level 4 and above are never published. The panic from a Level 4 announcement would cause mass interface disconnection โ which could itself trigger the cascade the forecast was warning about.
Pencil-47's predictions outperform Nexus's internal load-balancing projections
How It Gets Made
Pencil-47 maintains the most accurate forecast model โ and it outperforms Nexus's internal load-balancing projections. The reason is simple: Pencil-47's model incorporates human sensory data that no corporate instrument captures.
Counted Observations
The Counted feed observation data from across the interstitial zones โ headache clusters, interface dropout patterns, temperature anomalies reported by residents who feel the electromagnetic conditions in their bones before any sensor registers them.
Lamplighter Measurements
The Lamplighters contribute harmonic measurements from Grid junction points โ electromagnetic readings taken with analog instruments that function independently of the infrastructure they measure. Their data is the forecast's backbone.
Grid Load Data
Publicly available server farm activity schedules, power allocation records, and corporate maintenance announcements. The raw data everyone can see โ but only Pencil-47 correlates it with what the Counted feel and the Lamplighters measure.
The Pencil Matrices
Colored-pencil correlation charts that map all three data streams into tomorrow's forecast. Analog. Hand-drawn. Independent of every system they predict. By 04:00, the forecast is chalked onto junction walls and pushed to G Nook terminals. By 06:00, every informed Dregs resident knows what kind of day they're walking into.
What Runs on the Forecast
The Data Forecast is infrastructure โ as essential to the Dregs as the Grid itself. Decisions across the interstitial economy depend on it.
Forecast determines bidding strategy. A heavy-load day means stored energy prices spike at the Auction โ residents who read the forecast early bid before the price moves.
Cascade Risk levels feed directly into evacuation readiness. A sustained Level 3 forecast means refuge checks, buddy-system verification, and Lamplighter crews on standby.
High-fog days force impossible decisions. Call in sick and lose the day's pay โ or work through interference that degrades neural performance and risk contract penalties for underperformance.
Patience Cross's Noodle Shop
Closing decisions. A Thermal Index drop means fewer customers and a cold walk home. A high Fog Probability means the delivery runners won't be able to navigate. The forecast determines whether the shop opens at all.
Maintained by the same community ethos. When the forecast predicts Grid instability, the Blackout Economy's favor networks and skill exchanges shift to standby mode โ the informal infrastructure preparing for formal infrastructure to fail.
What the Forecast Proves
Why does communal observation outperform corporate monitoring?
Pencil-47's colored-pencil matrices predict electromagnetic conditions more accurately than Nexus's load-balancing algorithms. The corporate models optimize for processing efficiency. The communal model optimizes for what the weather does to human bodies. The data streams are different because the questions are different โ and the Dregs are asking the questions that matter to the people who live there.
Can analog tools measure a digital world?
The forecast is built on paper, colored pencils, chalk on walls, and the felt sense of electromagnetic conditions โ the anti-algorithmic approach that works precisely because it is independent of the system it measures. A digital forecast running on the Grid would be compromised by the very conditions it tries to predict. The analog method has no such vulnerability.
What happens when survival information has no corporate owner?
No entity profits from the forecast. No license is required to read it. No subscription gates the data. It exists because people need it, maintained by people who maintain it because it matters. The corporate equivalent does not exist โ not because it can't, but because measuring interference as human cognitive impact generates no revenue.
Field Report: 04:00 Update
Pre-dawn in the Dregs. The amber glow of G Nook terminals is the first light most residents see โ brighter than the corridors, warmer than the recycled air. The forecast appears as text on these screens: Load Weather, Thermal Index, Fog Probability. Three numbers that determine the shape of the day.
In the Lamplighter junction corridors, the same information appears in chalk โ maintenance shorthand that initiated residents read as fluently as printed text. White for normal conditions. Yellow for caution. Red chalk means stay close to home.
By 06:00, every informed Dregs resident knows what kind of day they're walking into. The forecast travels by word of mouth from there โ neighbors telling neighbors, parents warning children, workers adjusting plans. No broadcast. No notification. Just people talking to people about the weather, the way people always have.
The Level 5 Threshold
There has been one Level 5 cascade risk assessment in the forecast's history. It was not published. Instead, Pencil-47 personally visited every block captain in The Deep Dregs and delivered the warning face-to-face. The cascade occurred sixteen hours later. Mortality was a third of what models predicted for an unwarned population.
The official record shows no advance warning was given. The Dregs' survival rate is attributed to "infrastructure redundancy."
Nexus Knows
Nexus Central's infrastructure team has been quietly comparing their load-balancing projections against the Data Forecast for over two years. The communal forecast outperforms theirs by a margin that would be embarrassing if published. It has not been published. Instead, three Nexus engineers have been observed visiting G Nook terminals at 04:15 โ fifteen minutes after the forecast updates โ on mornings before critical load events.
"The forecast is not a service. It is a decision a community made โ that knowing what tomorrow's weather looks like is worth the effort of watching, measuring, and telling each other. That's all infrastructure ever was."
Pencil-47 โ /world/characters/pencil-47
Grid โ /world/systems/the-grid
The Power Auction Forecast determines bidding strategy. A heavy-load day means stored energy prices spike at the Auction โ residents who read the forecast early bid before the price moves. โ /world/locations/the-power-auction
The Dropout Protocol Cascade Risk levels feed directly into evacuation readiness. A sustained Level 3 forecast means refuge checks, buddy-system verification, and Lamplighter crews on standby. โ /world/systems/the-dropout-protocol
Forced-Focus Contracts High-fog days force impossible decisions. Call in sick and lose the day's pay โ or work through interference that degrades neural performance and risk contract penalties for underperformance. โ /world/systems/forced-focus-contracts
Patience Cross's Noodle Shop Closing decisions. A Thermal Index drop means fewer customers and a cold walk home. A high Fog Probability means the delivery runners won't be able to navigate. The forecast determines whether the shop opens at all. โ /world/characters/patience-cross
The Blackout Economy Maintained by the same community ethos. When the forecast predicts Grid instability, the Blackout Economy's favor networks and skill exchanges shift to standby mode โ the informal infrastructure preparing for formal infrastructure to fail. โ /world/systems/the-blackout-economy
Every morning at 04:00. No institution. No pay. Better than Nexus.
The forecast appears on G Nook terminal screens in amber text. It appears in chalk shorthand on Lamplighter junction walls. It moves through the Undervolt by word of mouth starting at 04:30, so that by 06:00 every informed Dregs resident knows what kind of day they are walking into. No corporation produces it. No institution maintains it. No one is paid.
The inputs are publicly available Grid load data, Counted member observations, Lamplighter harmonic measurements, and the particular instinct of people who have lived in the thermal shadow long enough to feel a server farm spin up through the soles of their feet. Pencil-47 โ the forecast's primary author โ compiles the daily report using colored pencils and hand-drawn matrices. Pencil-47's predictions outperform Nexus's internal load-balancing projections by a margin that has widened each of the last three years. Nexus's sensor grid cost an estimated 4.2 billion credits to deploy.
The Sprawl's most accurate model of its own electromagnetic environment is maintained by a person the formal economy has officially deprecated, distributed through chalk marks on concrete, and funded by nobody. The forecast works because no corporate model has ever attempted to measure what it measures. Nexus models server load as a compute variable. The forecast models server load as weather โ something that falls on people, that they breathe and walk through and make daily decisions inside of.
Dregs residents opted into the Sprawl's computational infrastructure without opting into its costs. The server farms that run their Second Mind subscriptions and employer systems generate heat, harmonic interference, and electromagnetic fog that falls unevenly โ concentrated in interstitial zones where land is cheap and regulations are historical curiosities. An entire population navigating daily life through conditions their employers generate, their infrastructure propagates, and their economy has never priced. The forecast is not a solution to this. It is a map.
Technical Brief โ The Vocabulary
The forecast uses terms that didn't exist before the Cascade. Nexus has its own vocabulary for the same phenomena. The vocabularies do not overlap, because they are not measuring the same thing.
Anticipated electromagnetic conditions derived from server farm activity schedules. "Heavy load expected S4-D 1400โ2200" means interface lag, power surges, and a temperature spike in the Dregs starting mid-afternoon. Corporate employees receive this information automatically through employer-provided environmental monitoring. Dregs residents receive it from chalk on a wall. The information is identical. The delivery infrastructure is not.
Predicted temperature differential between corporate and interstitial zones, expressed in degrees. A thermal index of +6 means the Dregs will run six degrees warmer than Nexus Central. High-index days make the Undervolt dangerous for extended habitation. Low-index days remove the Dregs' only free heating. The preferred range is +2 to +4. Residents call anything above +7 a "cooker." They do not have a name for days below +1. On those days the priority is not vocabulary.
Likelihood of sustained electromagnetic interference, expressed as a percentage and estimated duration. "Fog 70% / 8hr" means plan for a day when neural interfaces misfire, Second Mind subscriptions drop packets, and forced-focus contracts count employer-generated lag against personal performance scores. Workers on forced-focus contracts check fog probability before anything else. A high-fog sick day costs a shift's wages. A high-fog work day costs more. The forecast gives them the numbers. The decision is still theirs.
Probability of harmonic cascade on a 1โ5 scale. Level 4 and above are not published. The reasoning is circular and correct: publishing a Level 4 prediction would cause mass interface disconnection as residents panic, and mass disconnection would itself trigger the cascade the prediction warned about. The forecast's most important function is the one it cannot perform in public. Pencil-47 has recorded seven Level 4 readings in the last two years. All seven were communicated privately to the Lamplighters, who adjusted junction harmonics without public explanation. The public noticed nothing. That was the point.
The Counted members who contribute observation data walk their routes before dawn โ noting temperature differentials at junction points, the pitch of transformer hum, the feel of the air where corporate zones bleed heat into interstitial corridors. The Lamplighters provide harmonic measurements from the junction network, taken on analog instruments because digital sensors in the Dregs are subject to the same interference they'd be measuring. (This is not a workaround. This is the only method that works.)
The observational methodology the Counted uses requires months of training to internalize. The harmonic readings the Lamplighters provide require calibration expertise that Nexus technicians would recognize as professional-grade if they encountered it in a context they respected. None of it is compensated. The forecast exists in the economy the way air exists in the economy โ essential, unpriced, and therefore invisible to anyone measuring value in credits.
Nexus measures the same electromagnetic environment with a sensor grid spanning forty-seven sectors, AI-driven analytics pipelines, and executive dashboards that cost more per quarter than the Dregs' entire informal economy generates per year. The sensor grid produces a less accurate picture of the compute climate. The discrepancy is not mysterious. It reflects what each system was built to observe: Nexus measures what affects server output. The forecast measures what affects the people the servers are running on top of. These are different questions, and different questions produce different data.
The forecast's accuracy is a structural problem for anyone who would prefer the data not exist. If Pencil-47's predictions are more accurate than Nexus's internal models, that means either Nexus's sensor grid is optimized for the wrong measurement (it is), or the forecast contains data sources Nexus cannot access (it does โ human observation in zones where corporate monitoring infrastructure is sparse). Both conclusions are uncomfortable in different ways.
The Power Auction uses forecast data to set daily bidding strategy. The Dream Exchange delays settlement when the forecast predicts drought conditions. Patience Cross checks fog probability before deciding whether to open the noodle shop on high-interference days. The forecast has become load-bearing infrastructure for the informal economy โ which means Pencil-47 has become load-bearing infrastructure for the informal economy, and Pencil-47 is one person with pencils and no institutional protection.
The Sprawl's most consequential meteorological service has no redundancy, no backup author, and no succession plan. Pencil-47 has not identified this as a problem worth solving. The analyst who compiled this file is not certain whether that represents extraordinary confidence or something quieter.
- Primary author. The colored-pencil matrices are the forecast's analytical engine. The forecast is, in material terms, Pencil-47.
- The phenomenon the forecast predicts โ electromagnetic conditions produced by the Sprawl's computational infrastructure falling on the people beneath it.
- Member observation data feeds the forecast's ground-truth layer. The Counted's routes exist for mutual aid; the forecast data is a byproduct of that work.
- Harmonic measurements from the junction network. They also act on Level 4+ data without explanation. The public relationship is infrastructure inputs. The private relationship is emergency coordination.
- Forecast determines daily bidding strategy. High-load forecasts change what power access is worth and who bids for it.
- Delays settlement when forecast predicts drought. The Exchange's operations are timed around predicted interference.
- Workers use fog probability to calculate daily sick-day decisions. The forecast is the only tool available for this calculation.
- At least one Nexus infrastructure division has been cross-referencing internal load projections against the public forecast for the past eighteen months. Whether this is competitive benchmarking or something more operational is not confirmed.
- Pencil-47 has declined three separate offers to share methodology in exchange for undisclosed compensation. The offers are described as coming from "institutional parties." No source has named the institution.
- The seven Level 4 cascade readings are not documented anywhere the public can verify them. Lamplighter coordination logs for those dates show "routine harmonic maintenance." The Lamplighters' definition of routine may require revision.
- The forecast's distribution via chalk shorthand uses a notation system the Lamplighters developed internally. The system was not formally shared with the forecast. Pencil-47 apparently adapted it independently. The Lamplighters have no recorded explanation for how this occurred.
Indexed โ 1 line preserved from the earlier filing.
the data forecast hero image
Connected To
Supporting Connections

โ